
An in-house A/B testing platform for a video-streaming organization.
The streaming team needed to run real experiments against real customers — not gut-feel design changes. We didn't have a tool for that. Off-the-shelf platforms didn't speak to our data warehouse, and the engineering org had built ad-hoc scripts that only a handful of analysts could read.
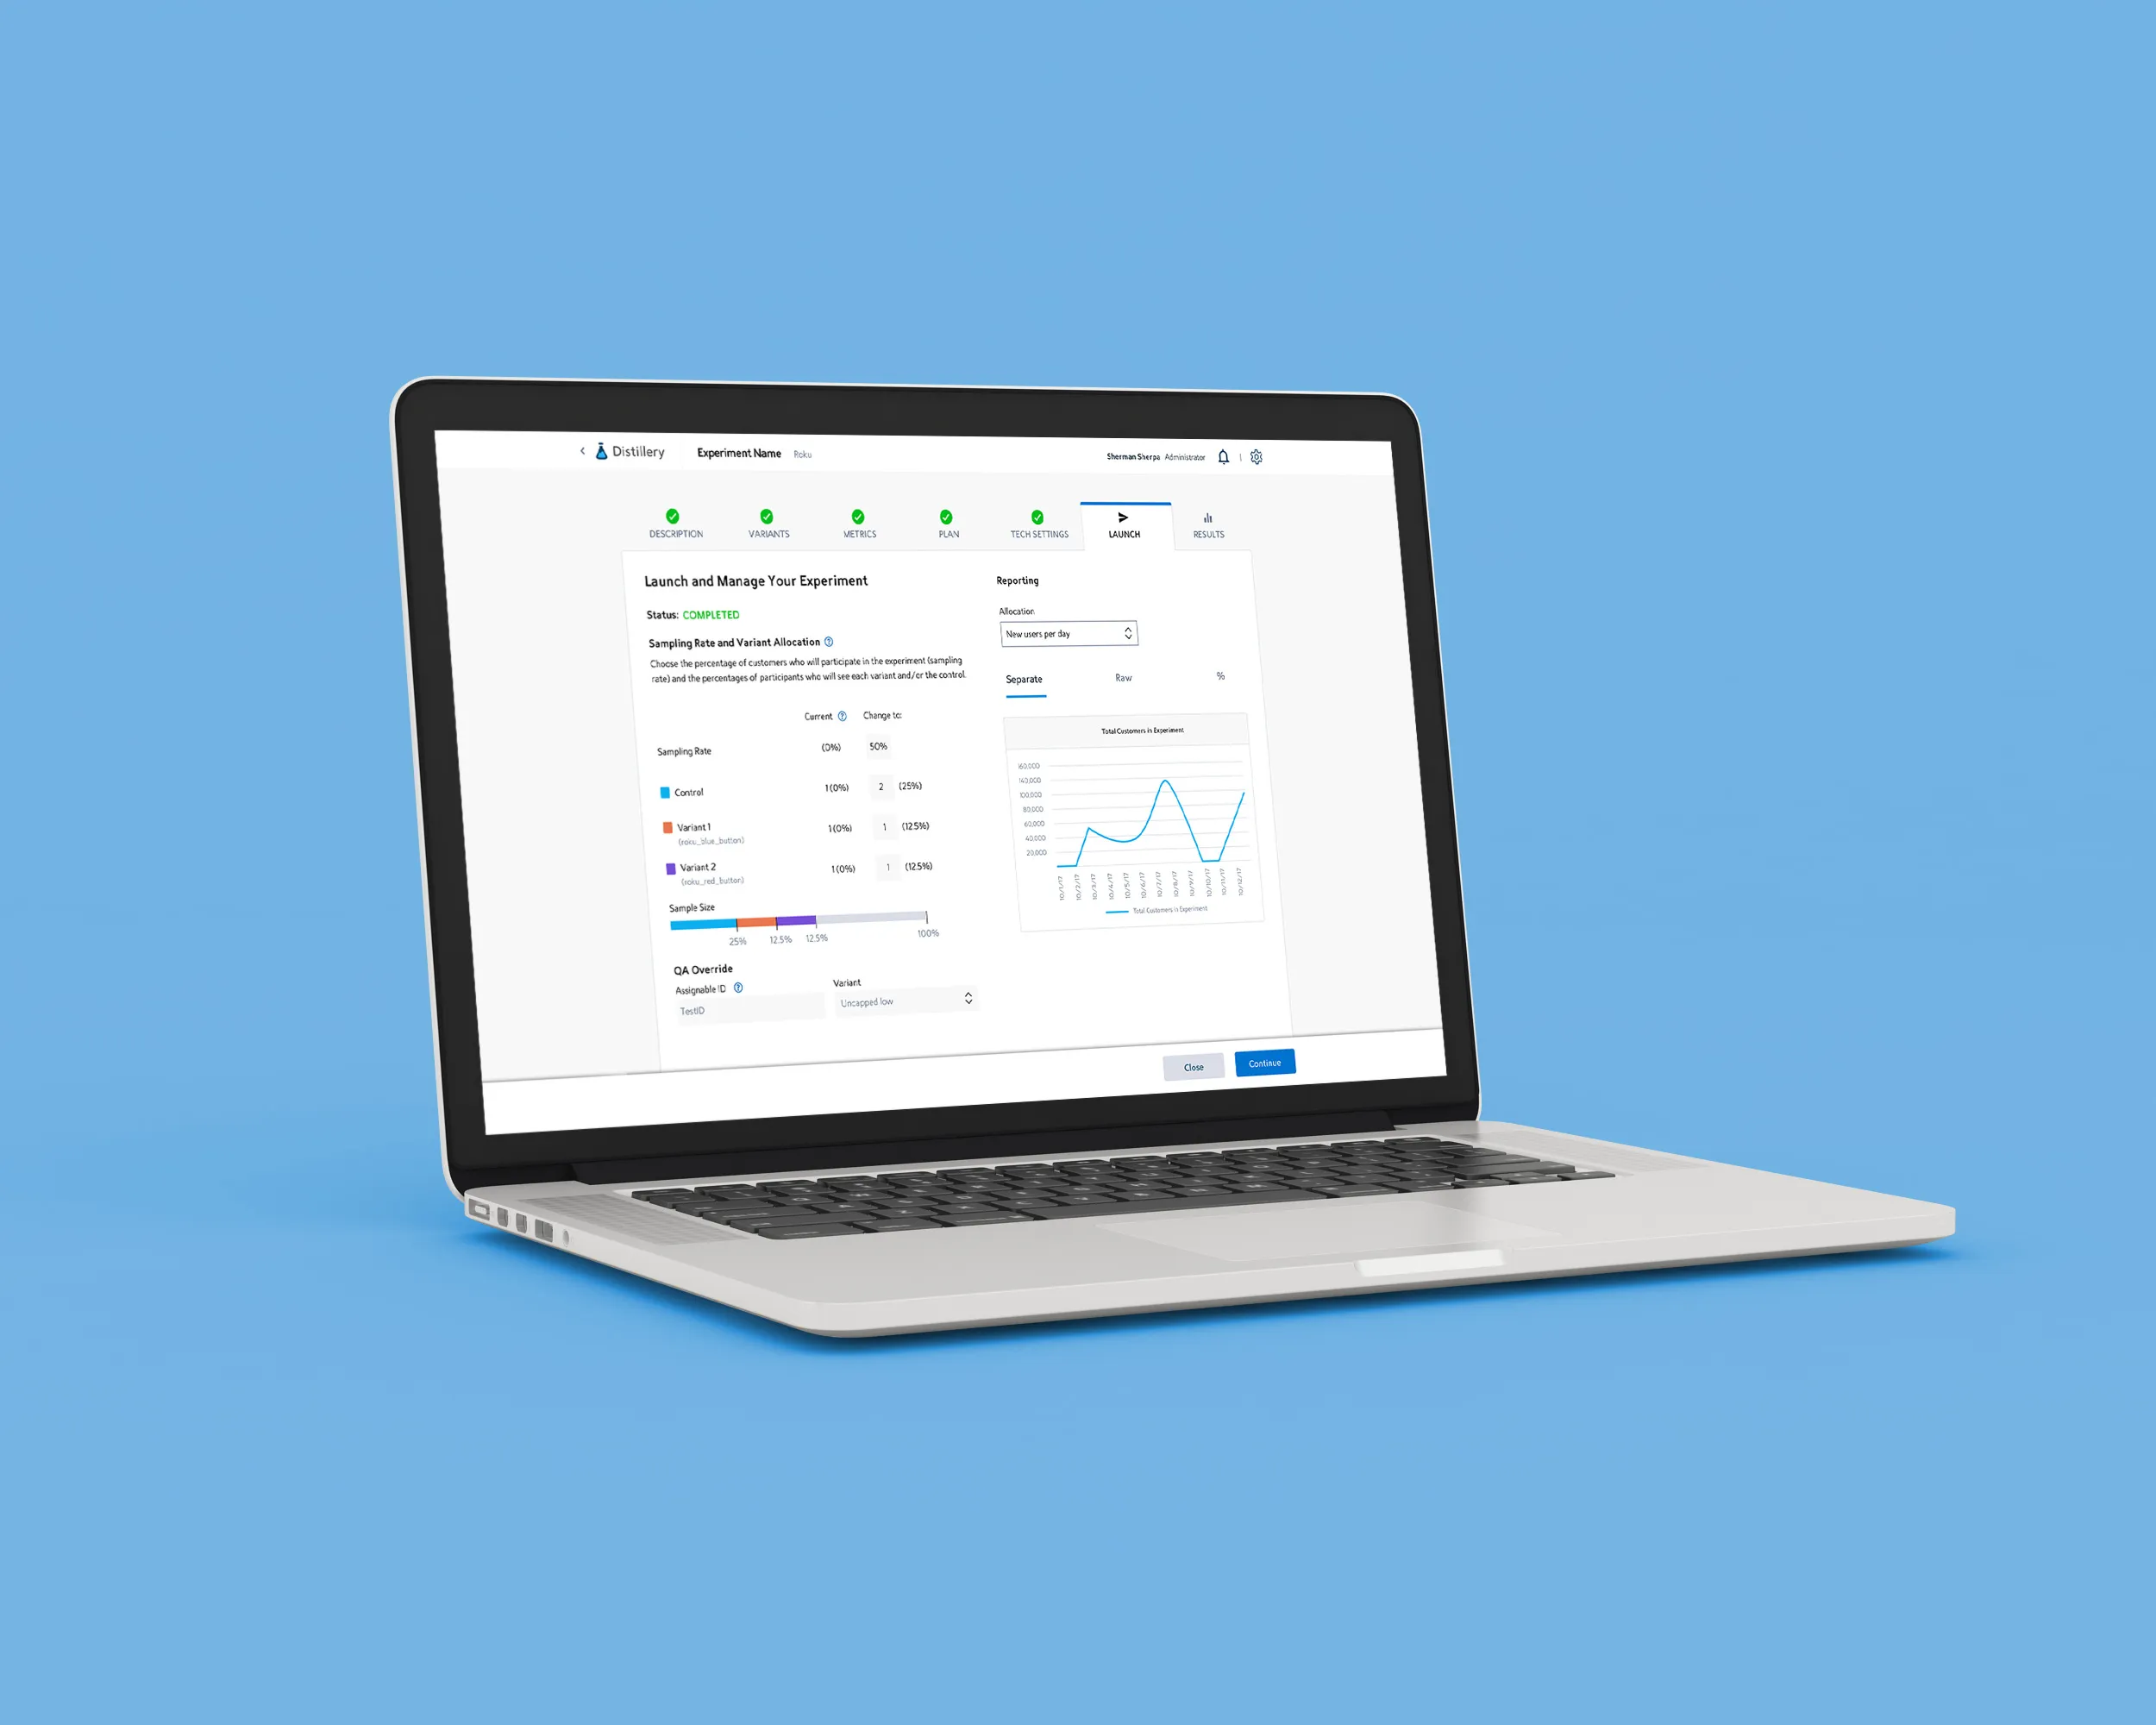
So we built our own. Distillery was the in-house A/B testing platform for the streaming product, designed to make experimentation legible to PMs, designers, and engineers alike.
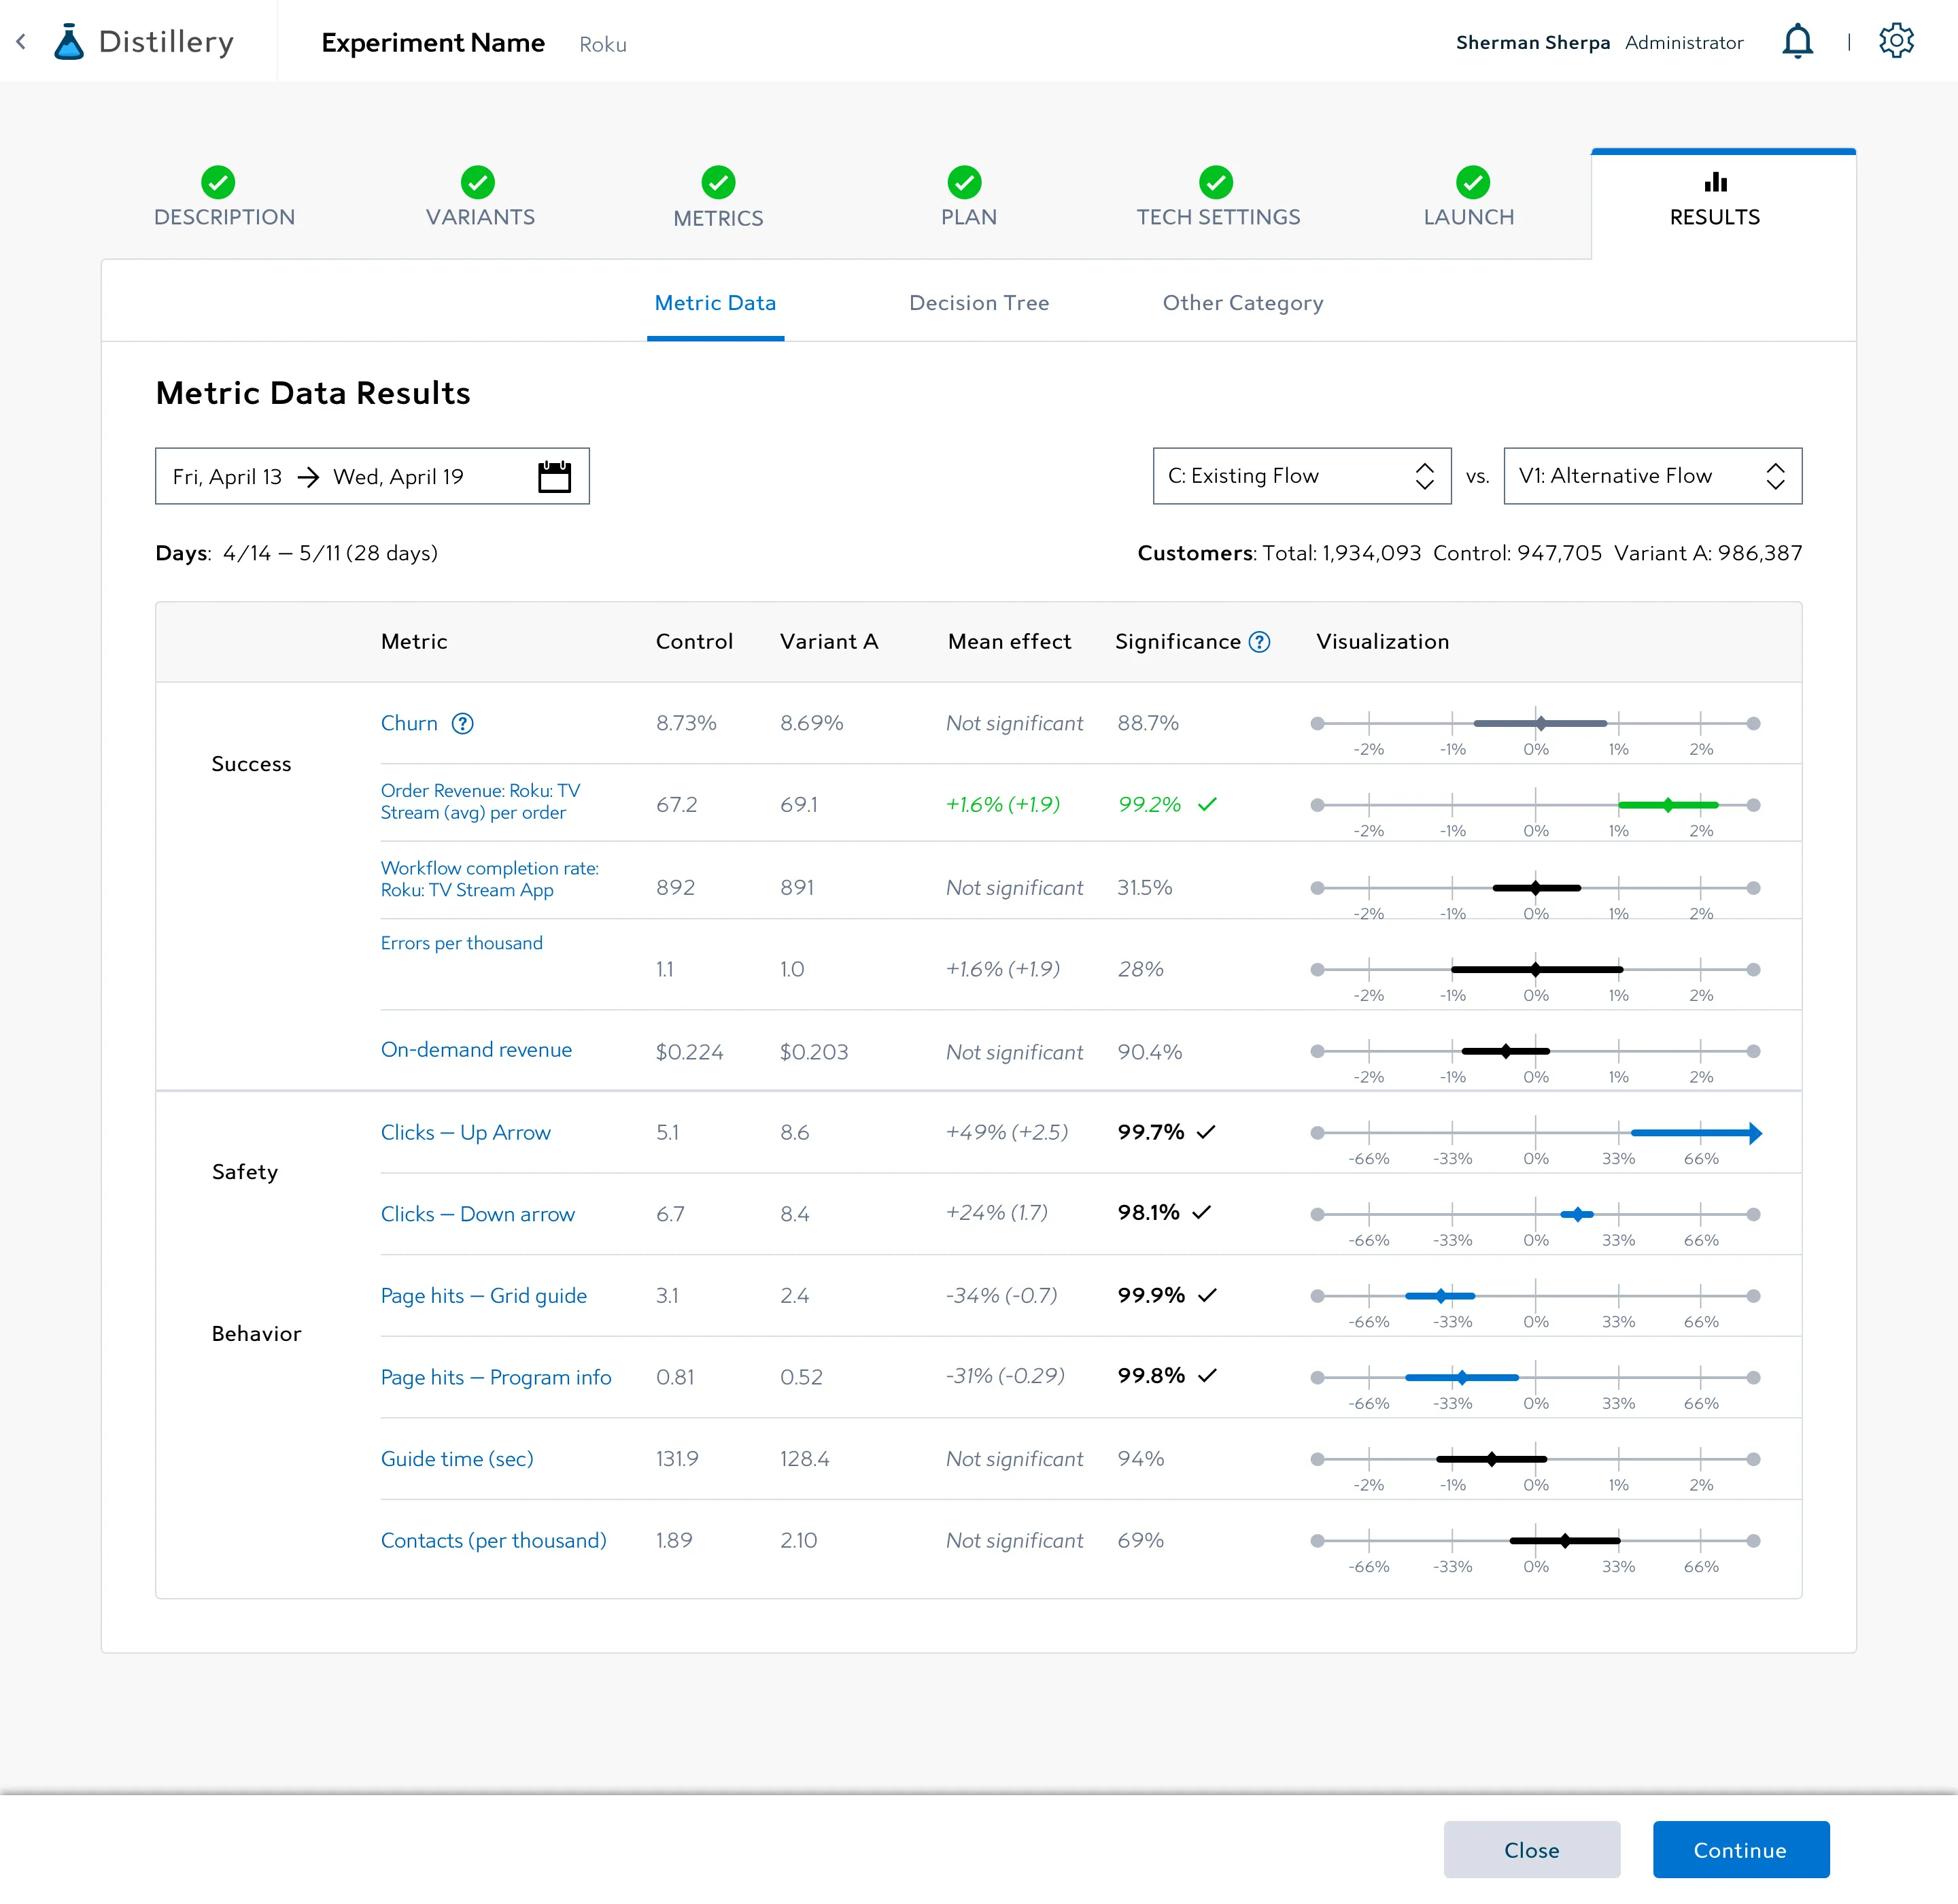
It's one thing to ask whether a blue button beats an orange button. It's another to communicate variants, control groups, mean effects, and statistical significance to people who don't live in the data every day. That second job — translation — is what the design needed to solve.
UX designers aren't scientists or mind readers. The job here was to ask the questions everyone else assumed they already knew the answer to:
I worked closely with stakeholders in product, data science, and engineering — translating business requirements into deliverables developers could build against. A researcher, a UX designer with too much coffee, and a UI designer can take you a long way if you keep asking the right questions.
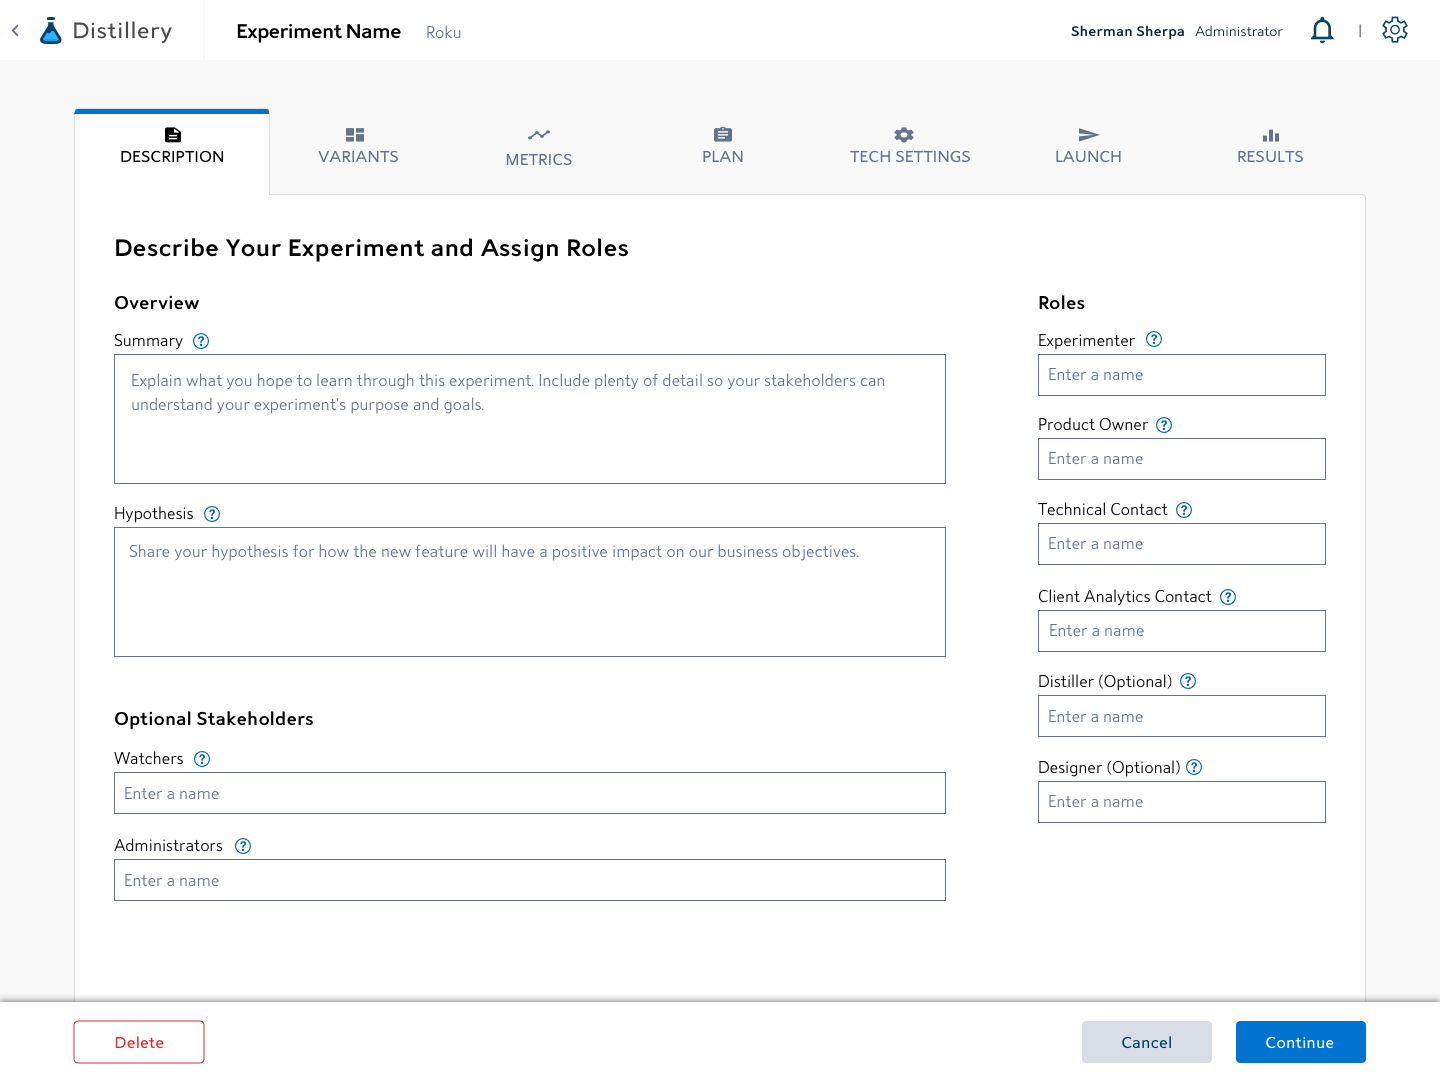
A guided five-step flow — Describe, Variants, Metrics, Plan, Tech Settings, Launch — replaced what used to be a YAML config file.
Launch and read the results in the same surface — no spreadsheet handoff, no tribal knowledge required.
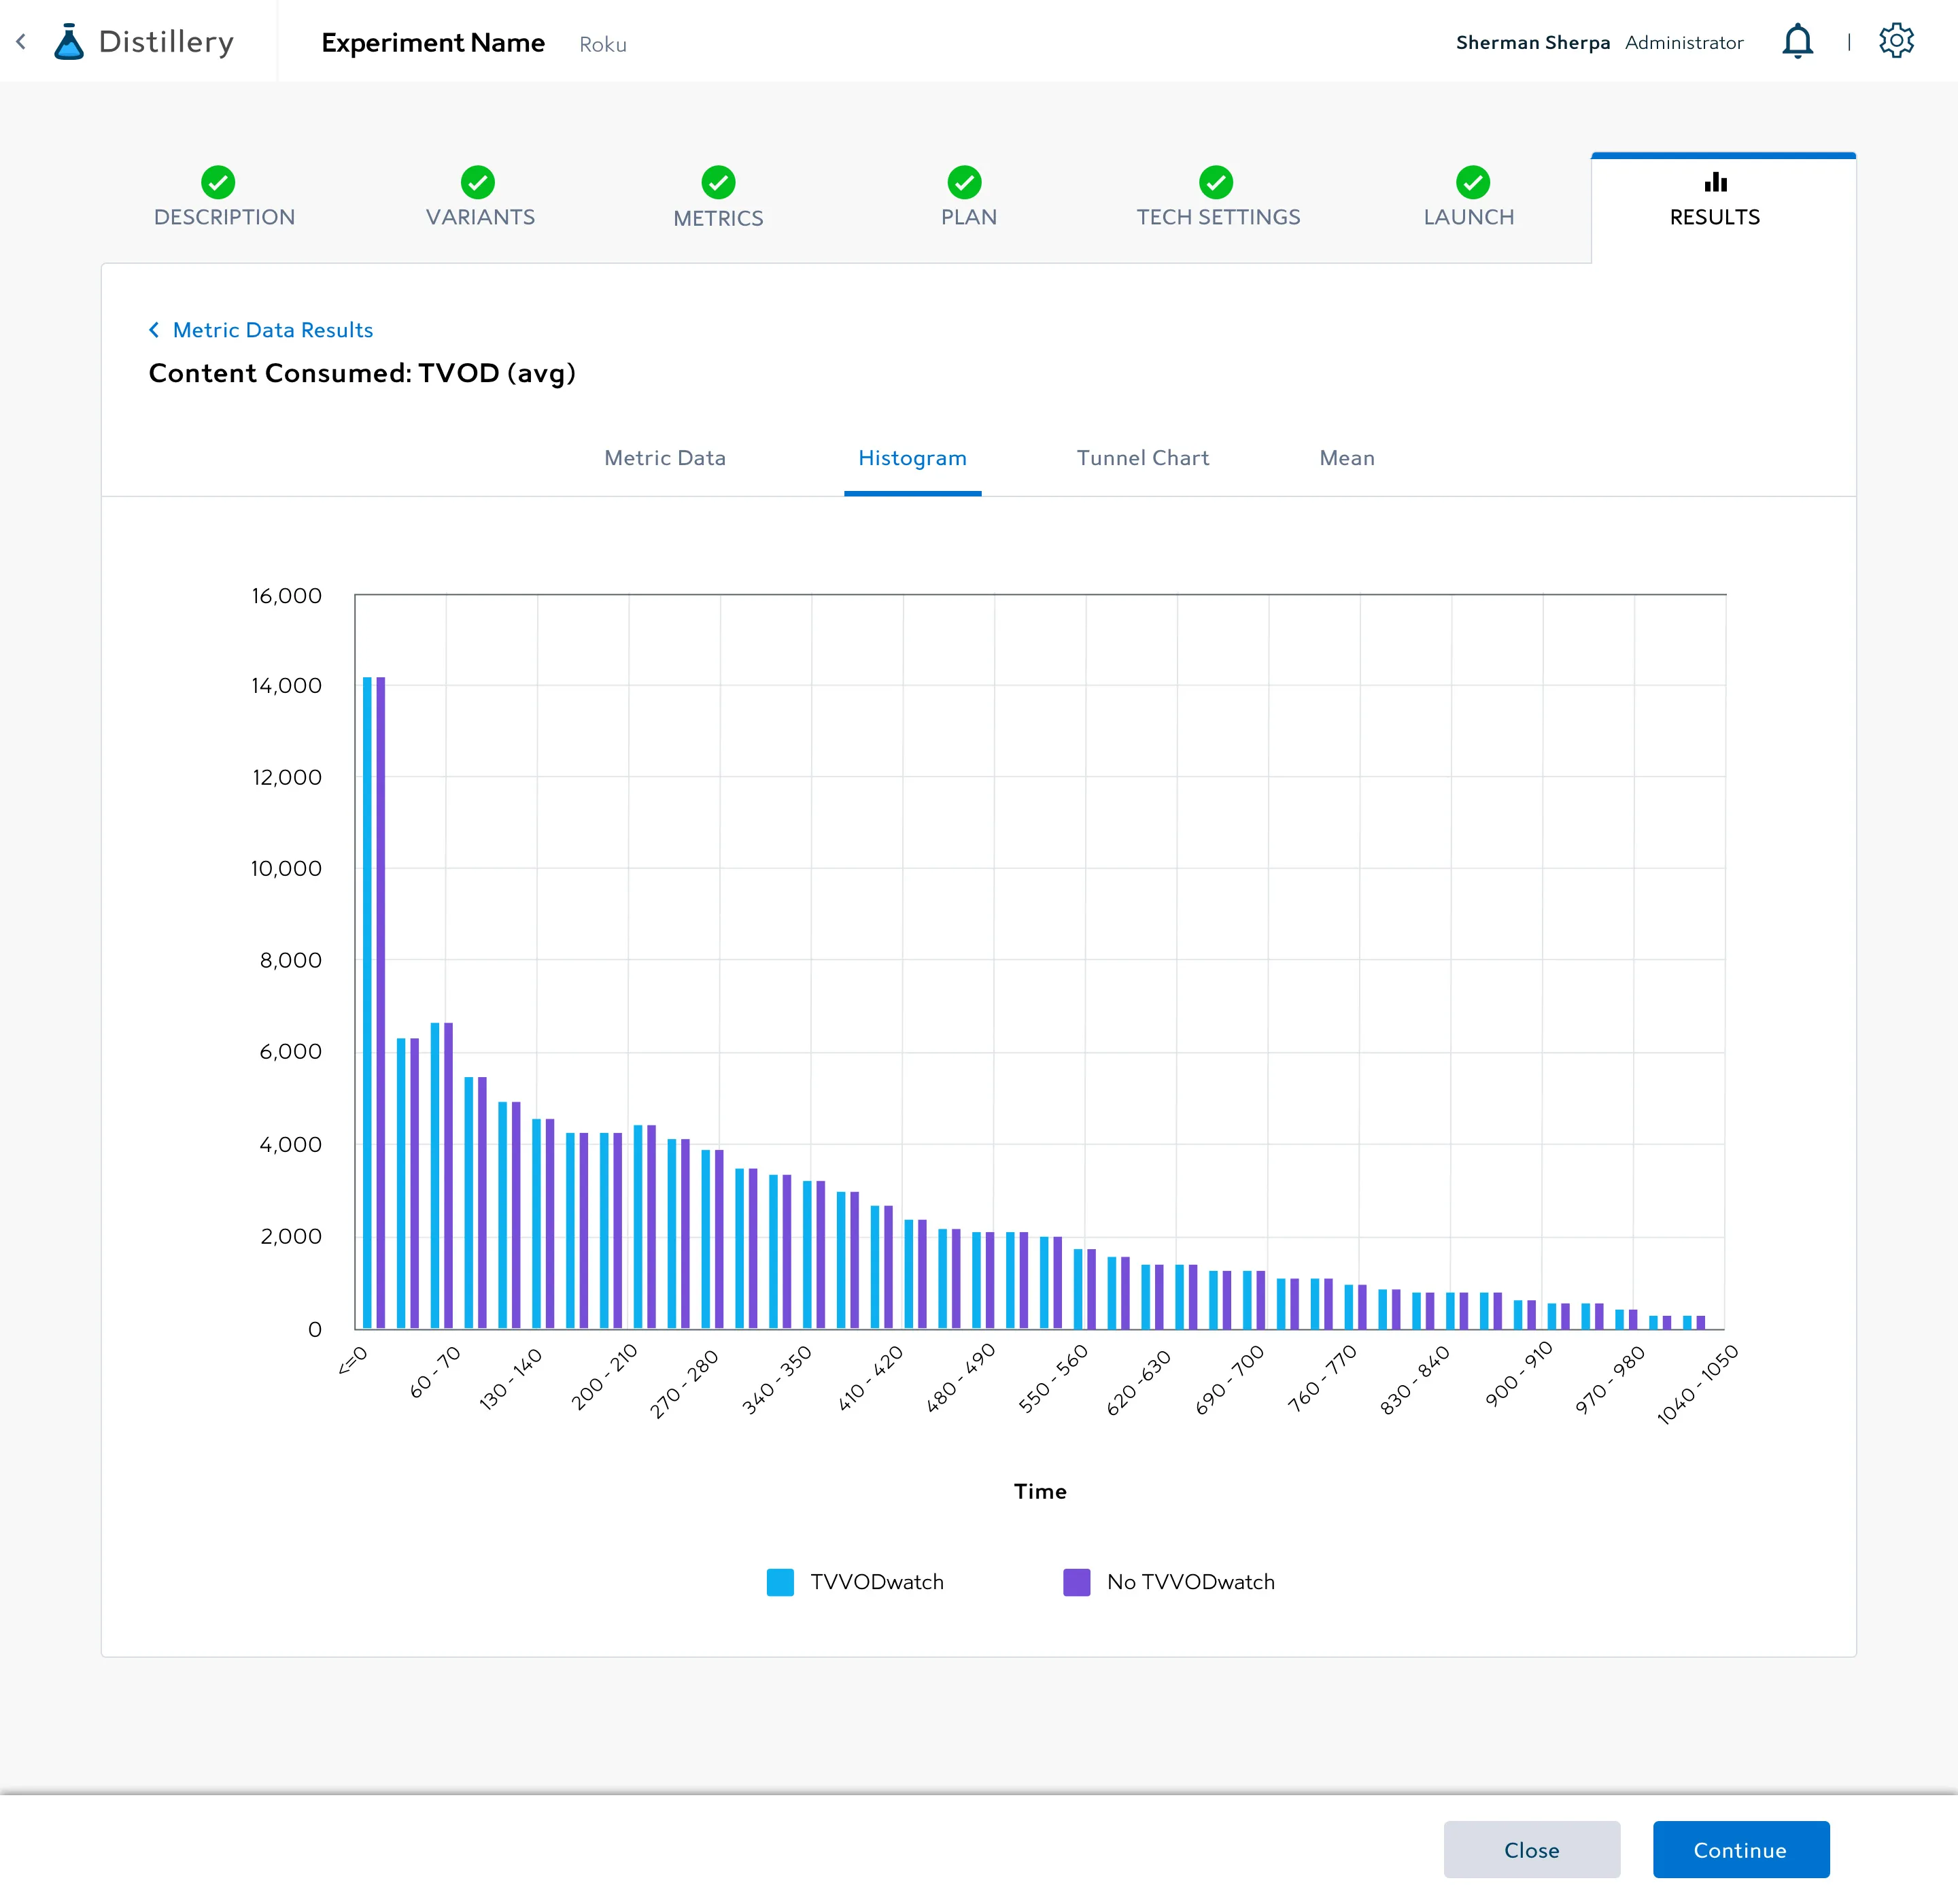
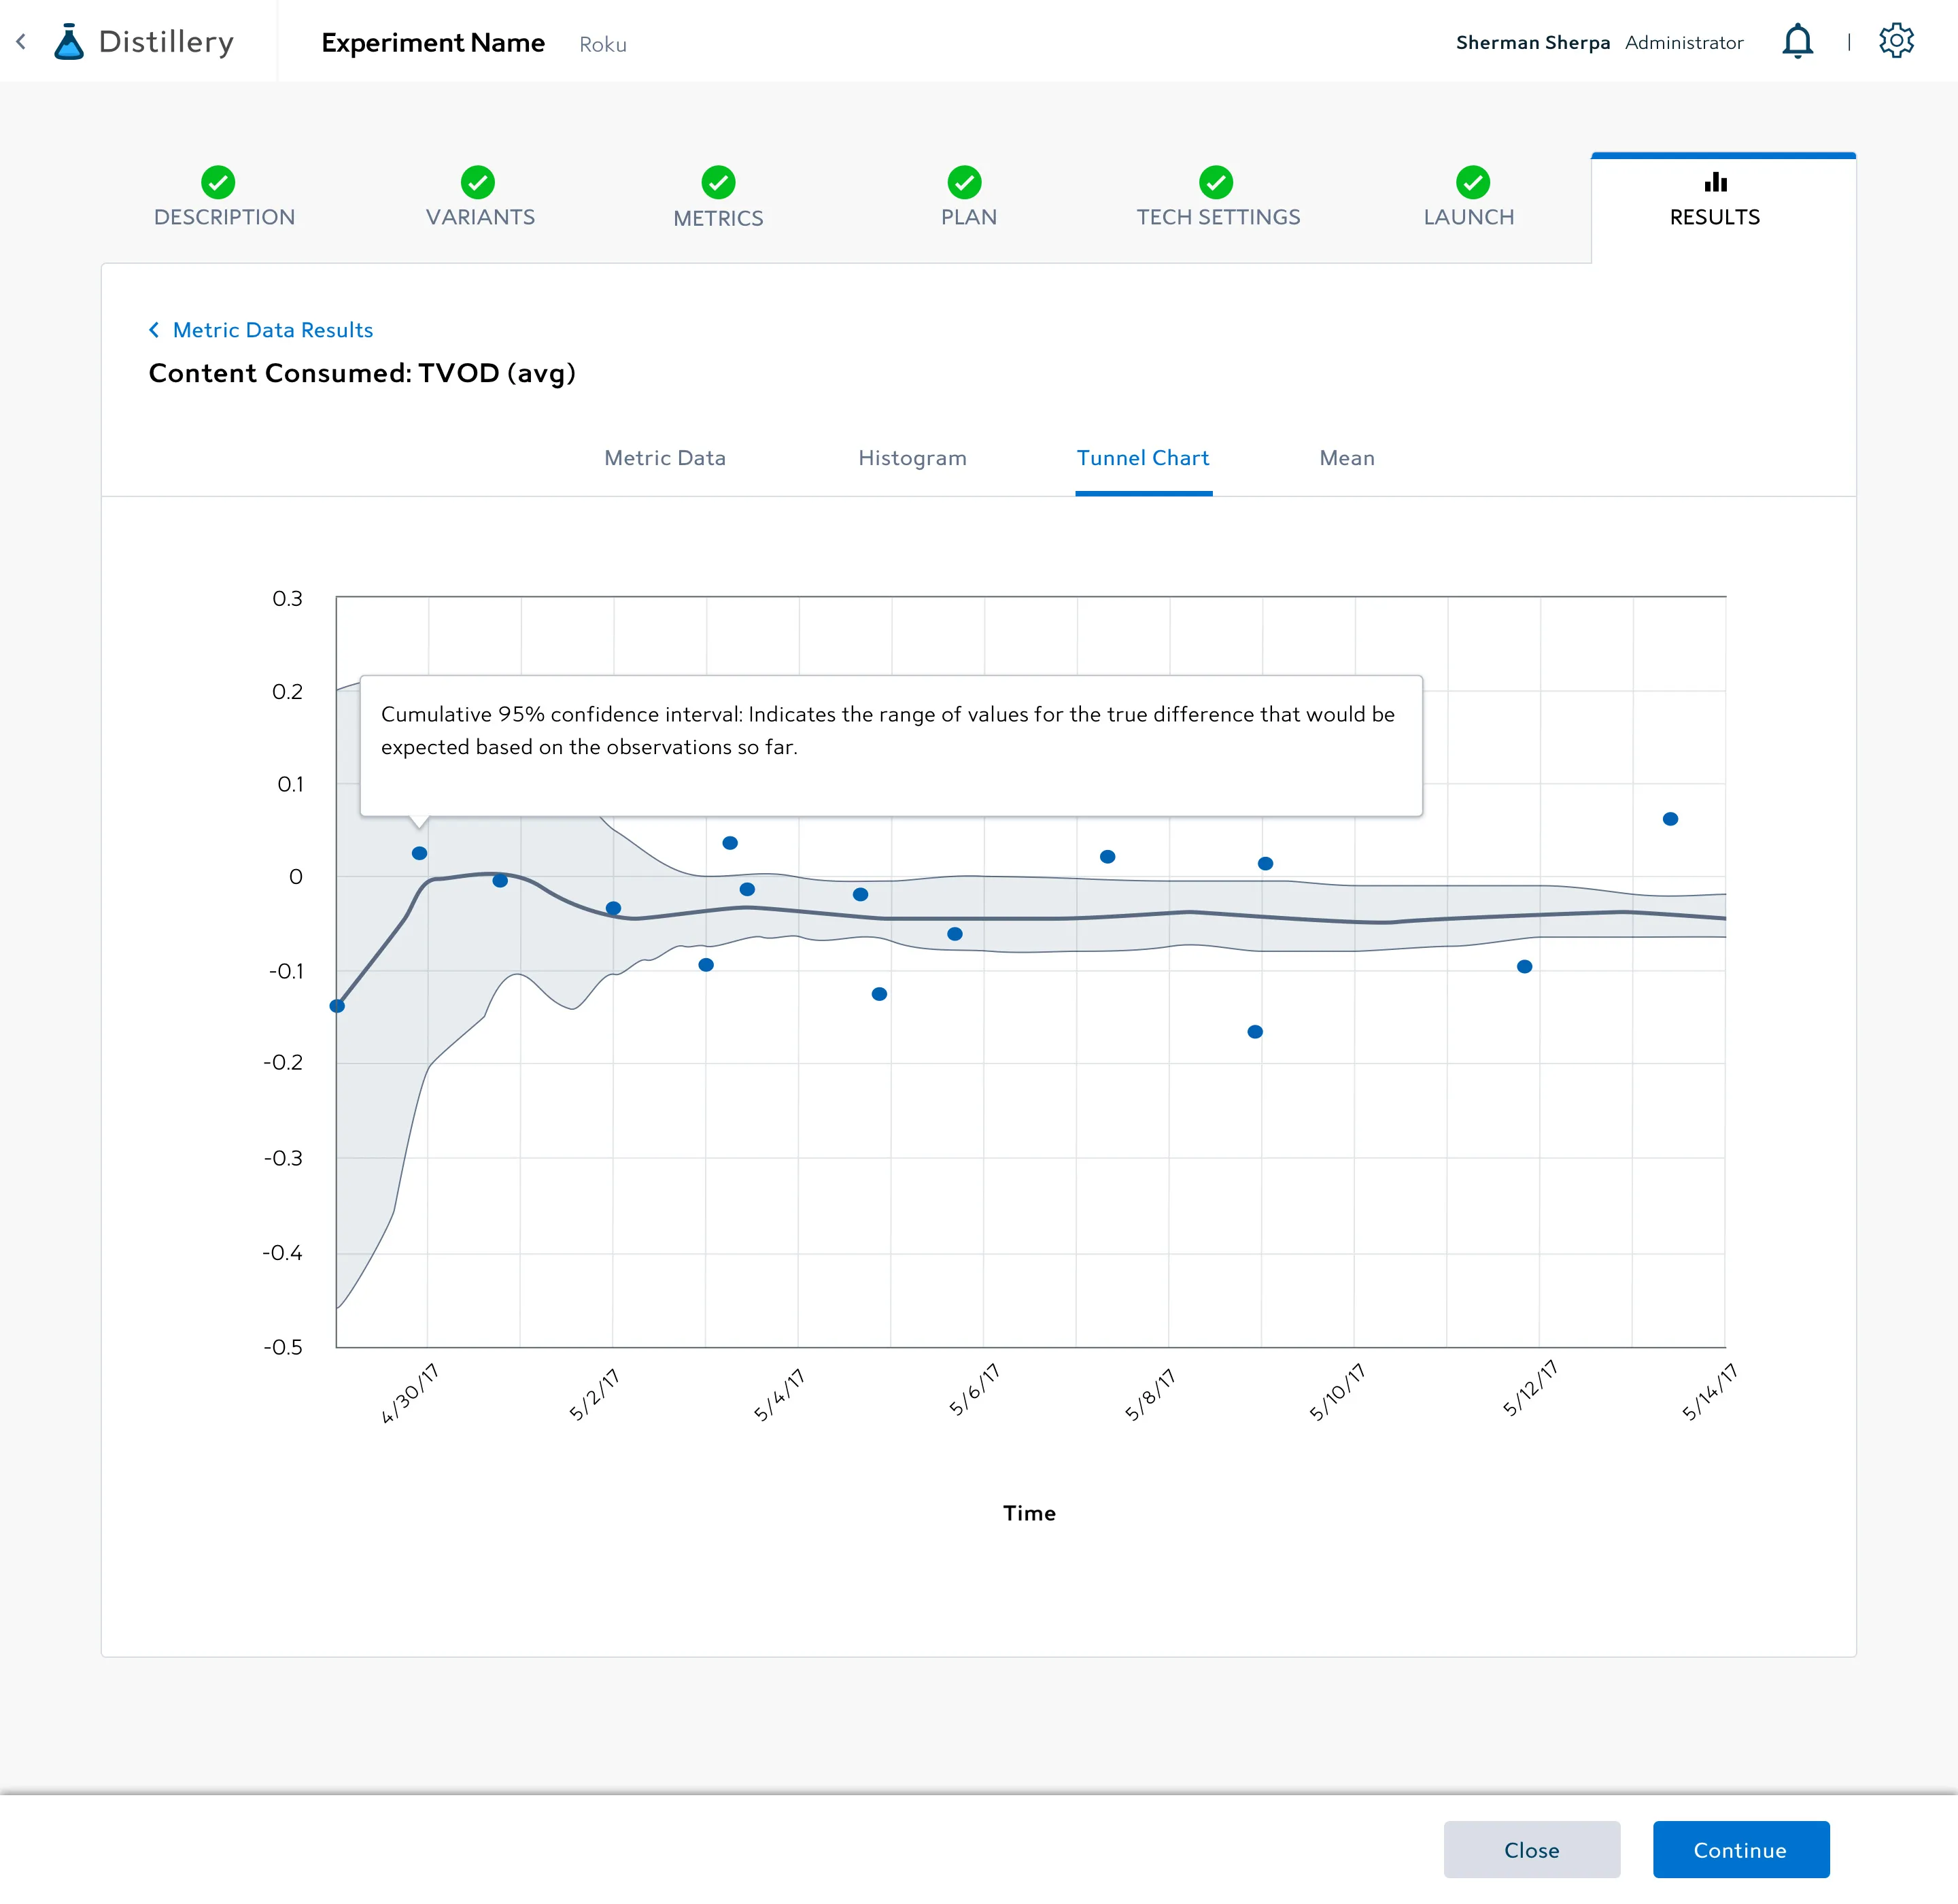
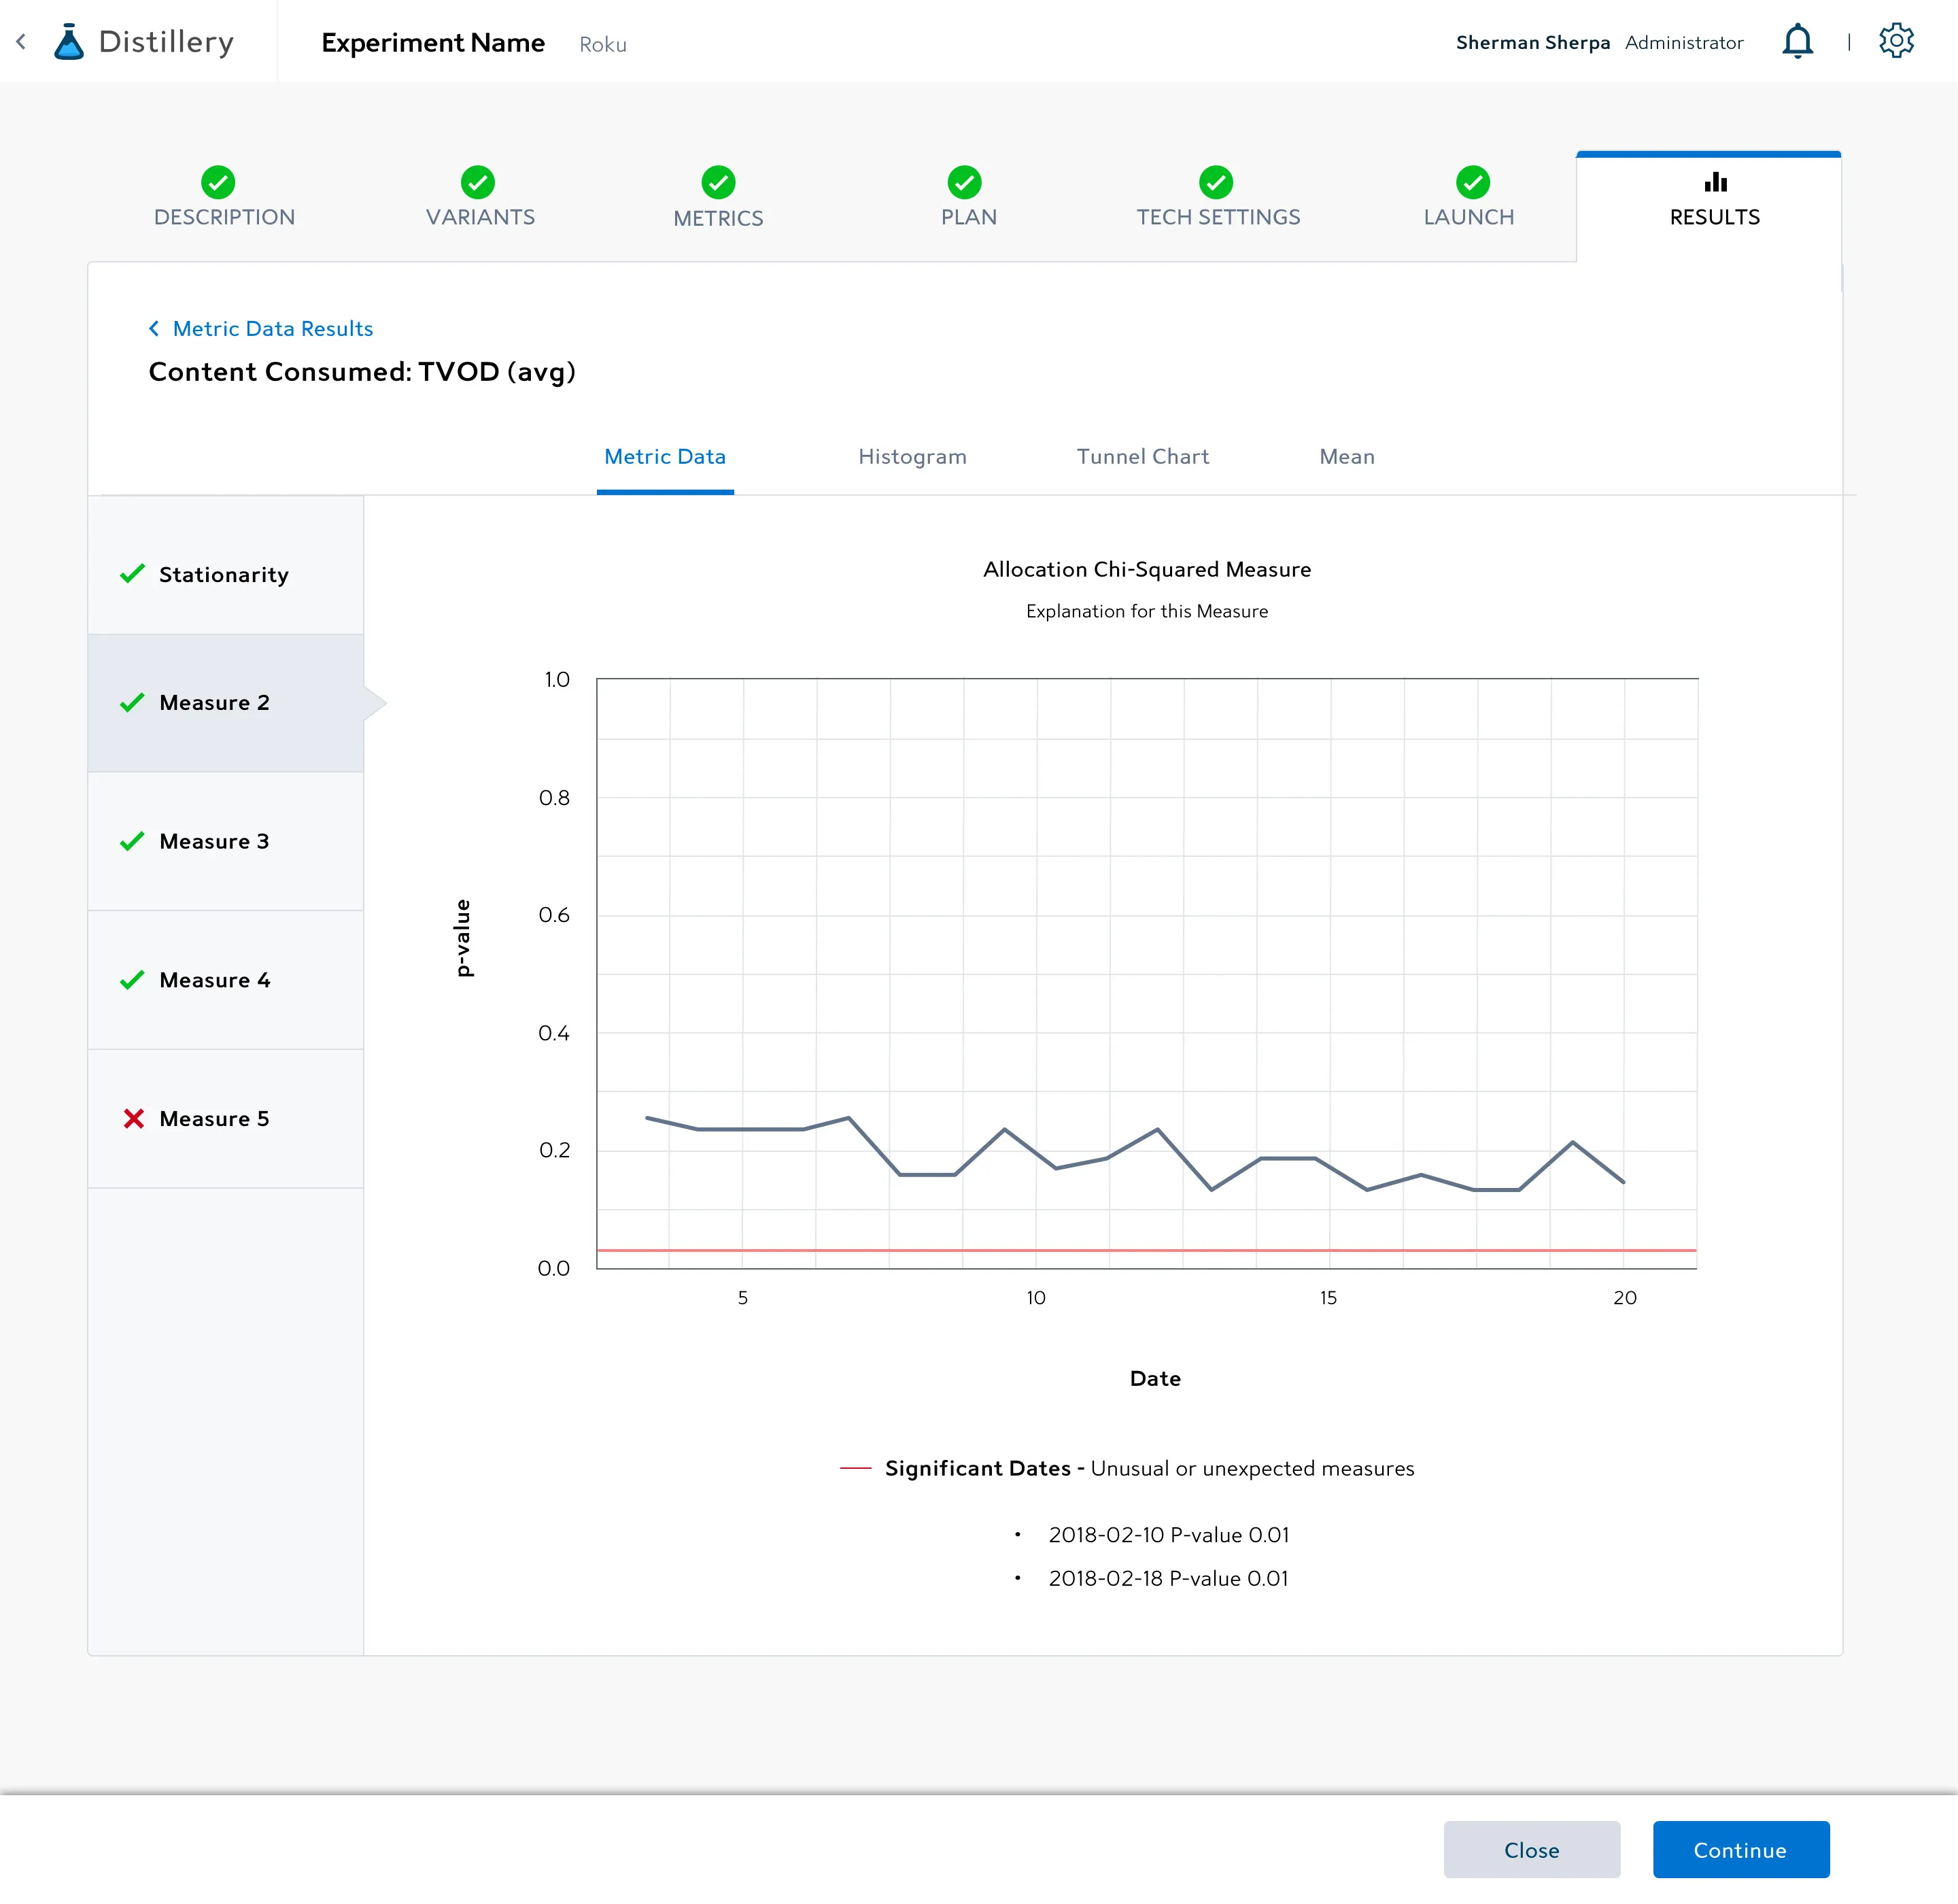
Statistical significance, expressed in plots a PM can actually read.
The product reads like a checklist because it is one. Distillery walks the experimenter through six discrete decisions — describe the test, define variants, pick the metrics, plan the rollout, set tech parameters, launch — with progress indicators that reveal where you are and what's incomplete.
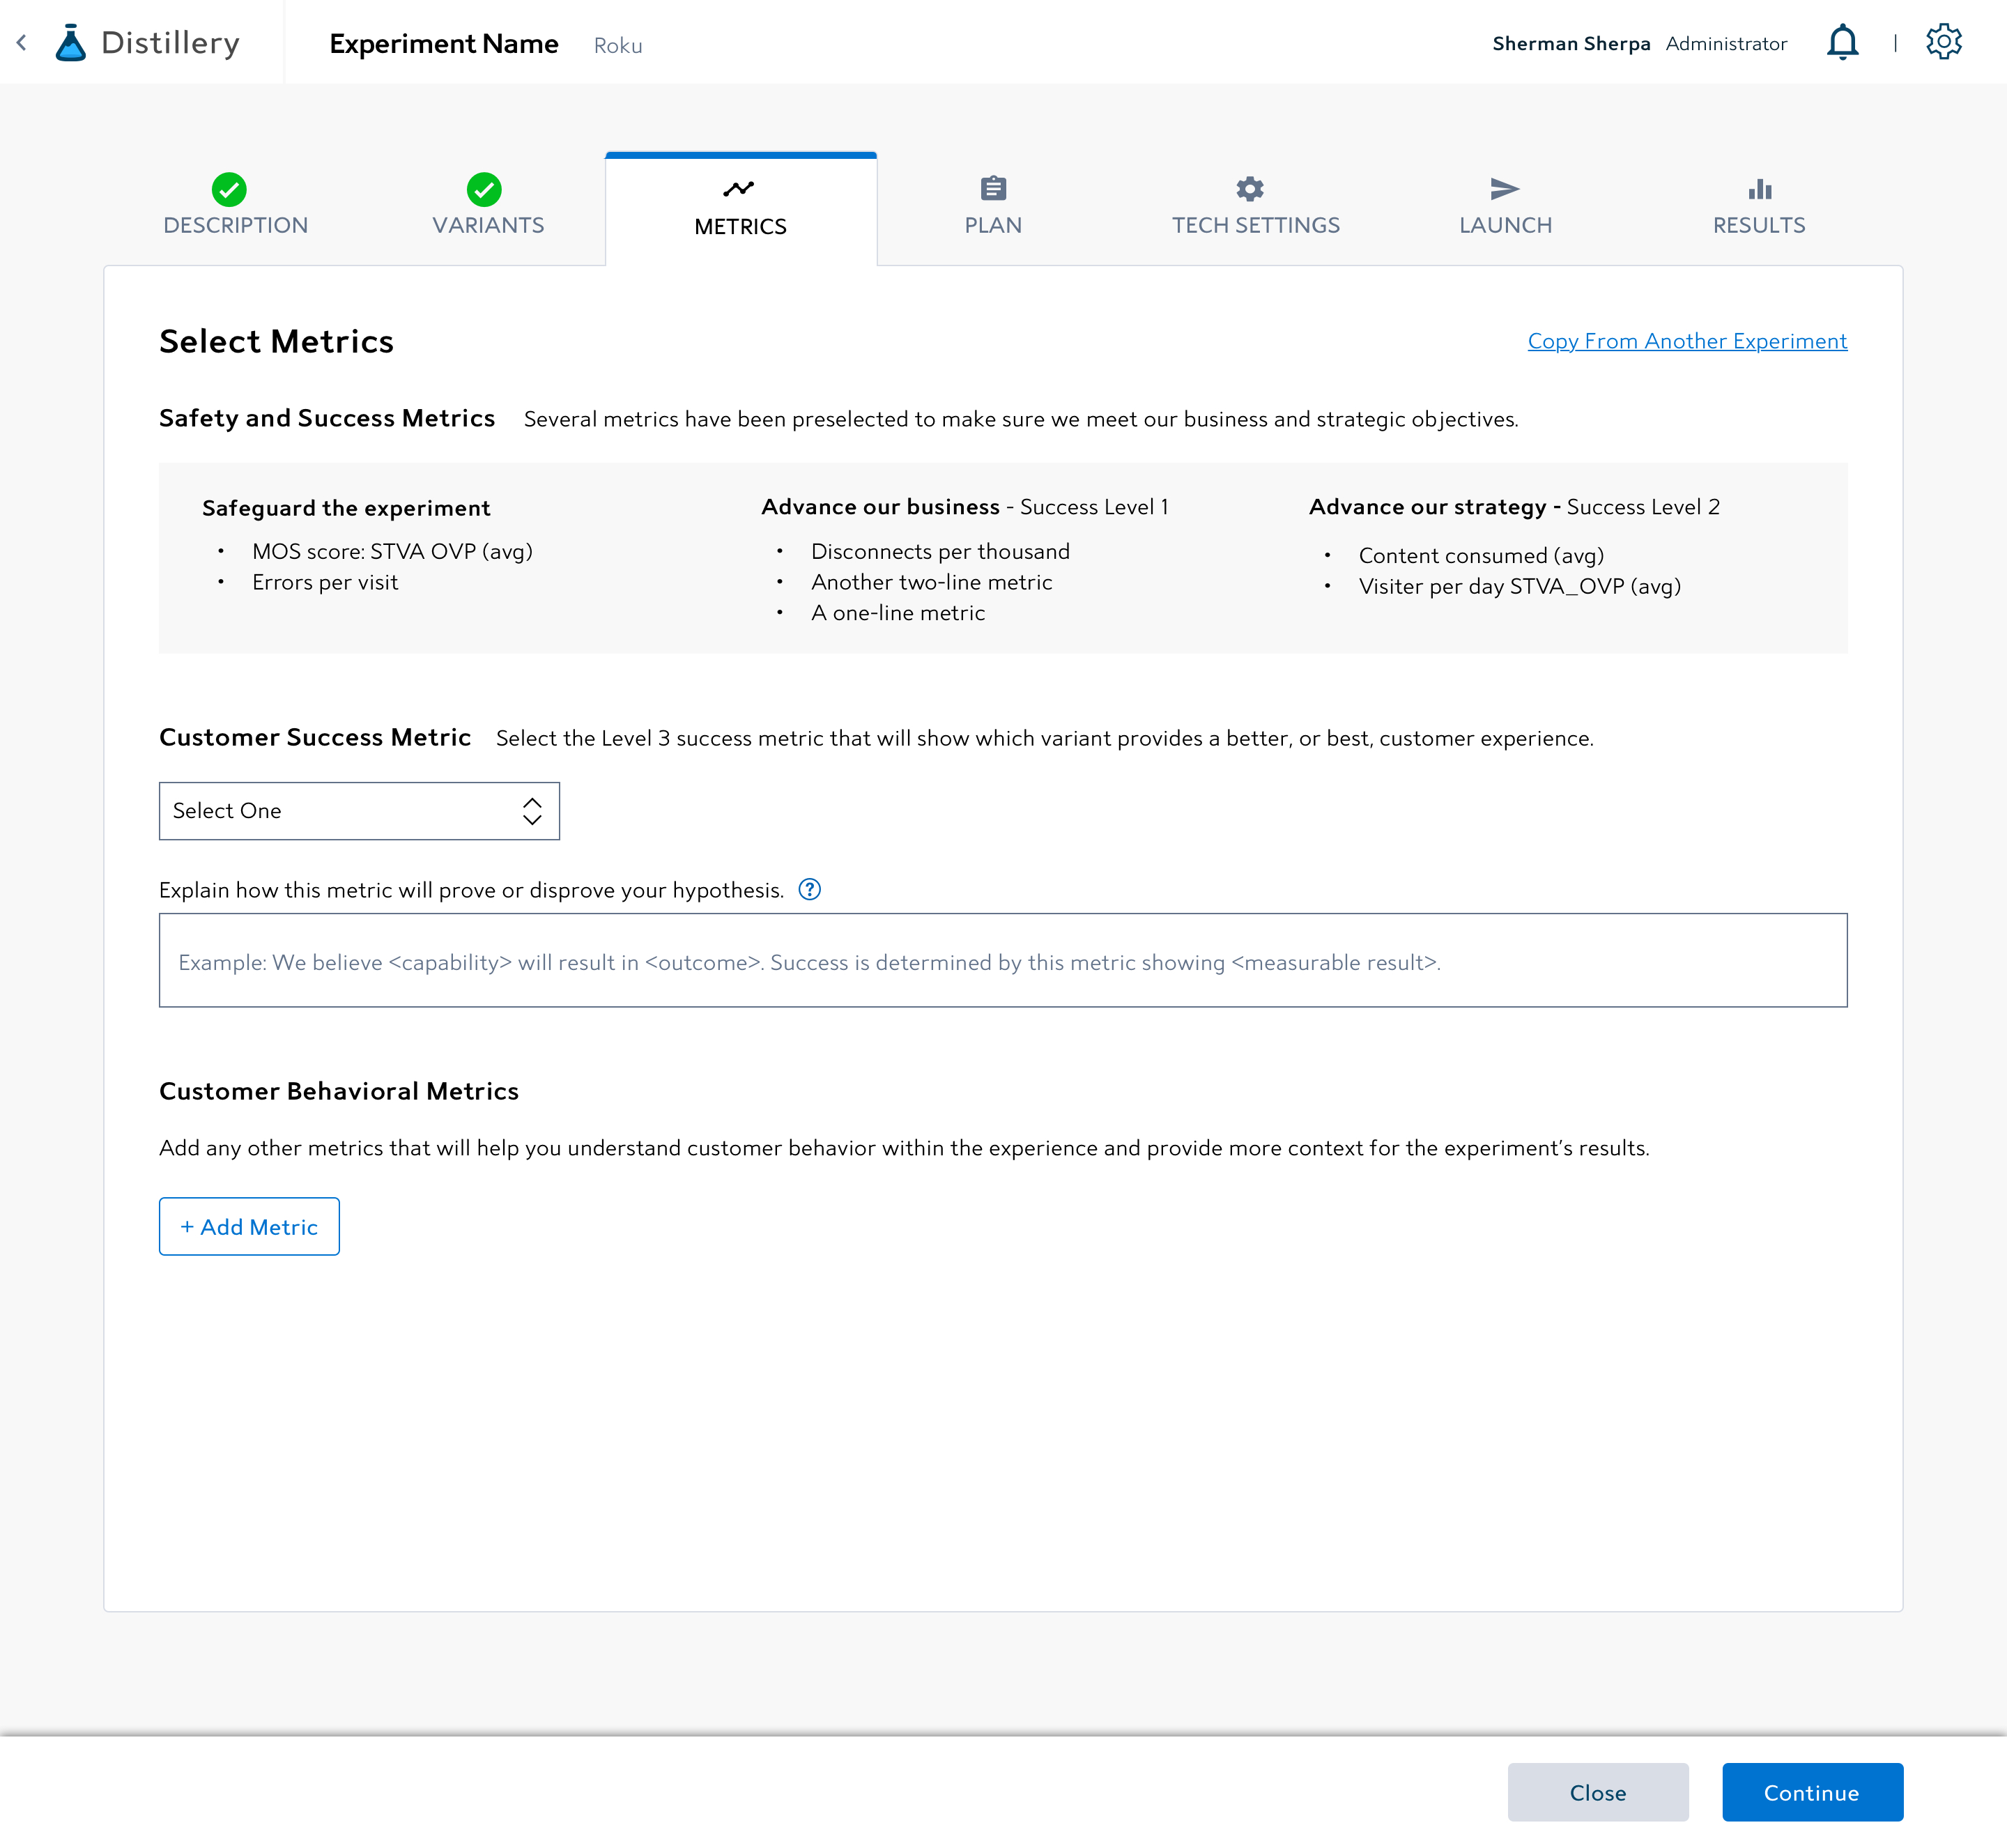
The same shape that makes the tool approachable is what makes the data trustworthy on the other end. If you've named your hypothesis, declared your safeguards, and selected your customer success metric upfront, the results screen has something honest to compare against.
Hide the math. Surface the decisions. Make the trade-offs visible.
Distillery became the streaming team's default experimentation surface — not because the team was forced to use it, but because it spoke their language. Decisions that used to live in tickets started living in the product, where everyone could see them.